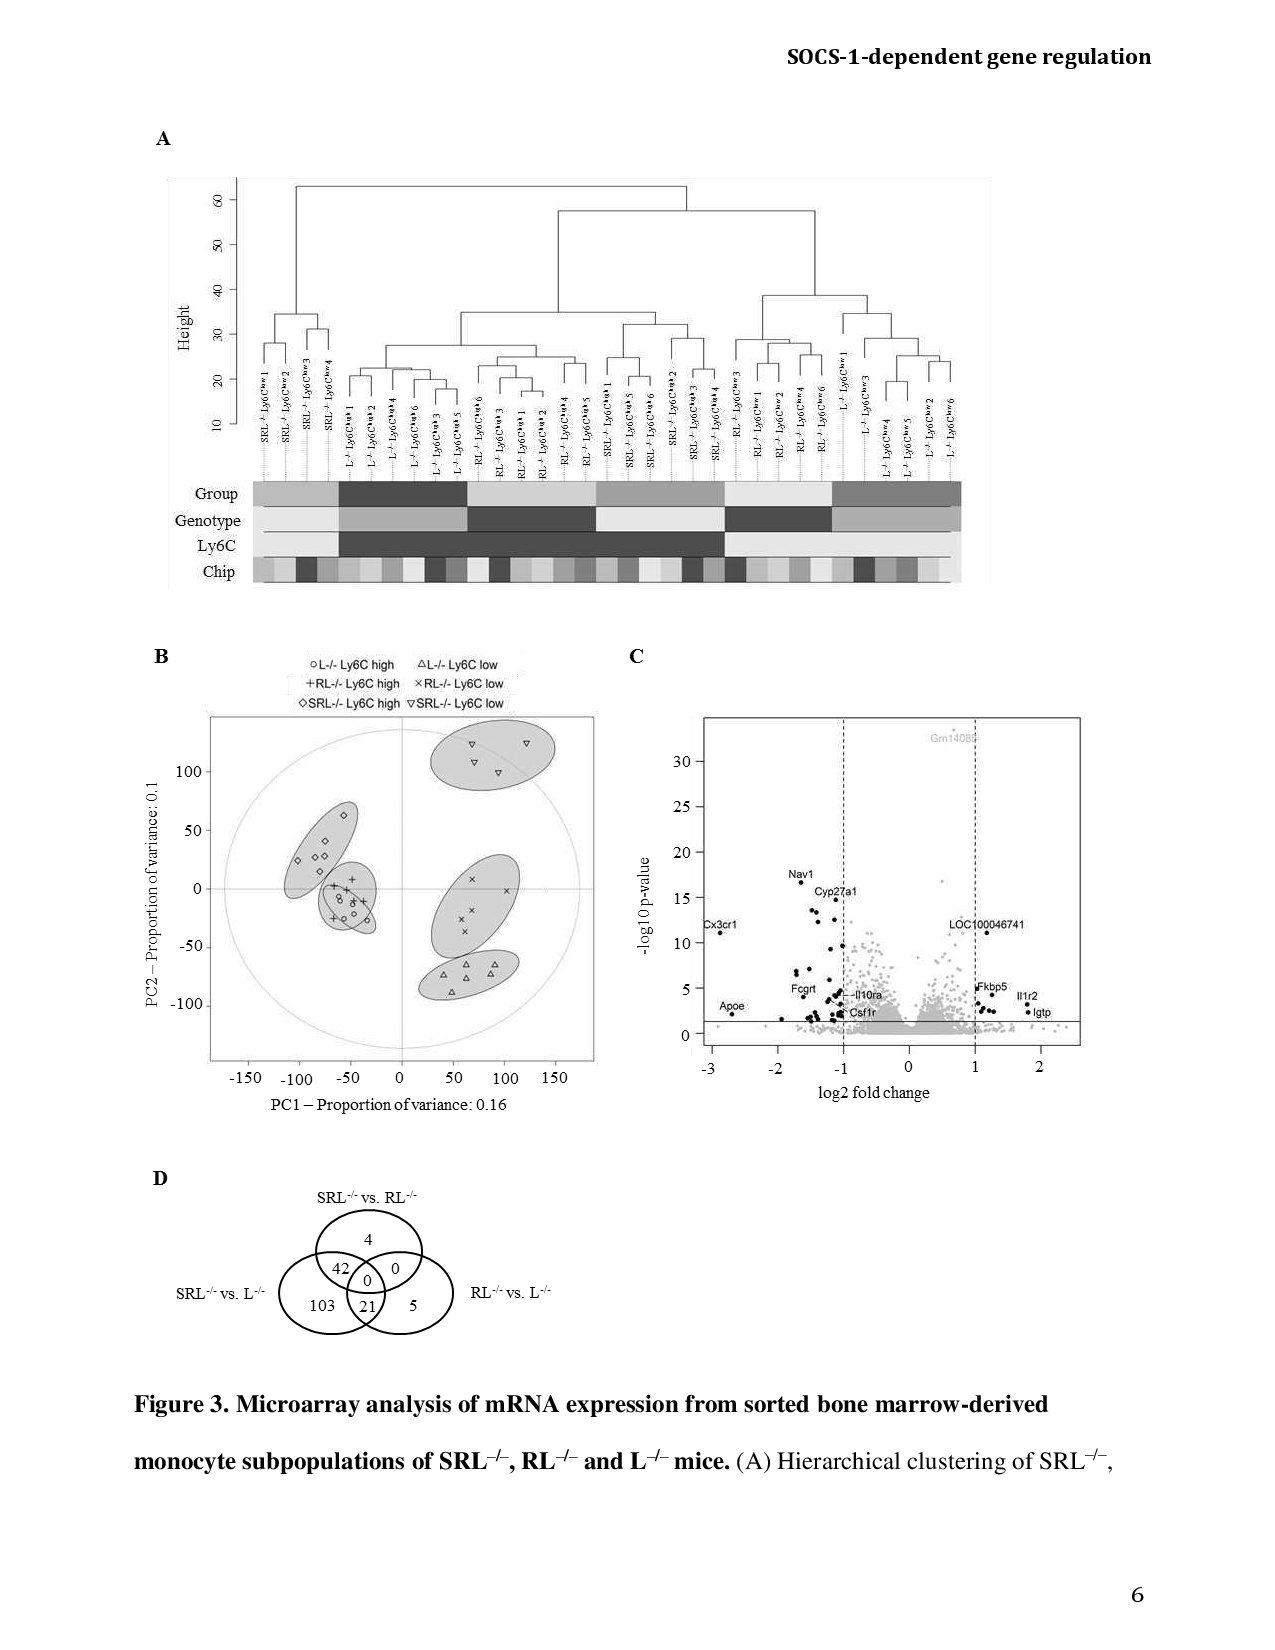
Fig. 3. Microarray analysis of mRNA expression from sorted bone marrow-derived monocyte subpopulations of SRL-/-, RL-/- and L-/- mice. (A) Hierarchical clustering of SRL-/-, RL-/- and L-/- samples are shown as sample dendrogram. Samples are annotated by grayscale codes indicating respective group replicates, genotype (SRL-/-, RL-/-, L-/-), Ly6C expression (high, low) and microarray allocation (6 arrays in total). (B) Principal component analysis (PCA) of mRNA expression data is illustrated using the first two principal components. The plot illustrates the projection of all SRL-/-, RL-/- and L-/- monocyte samples onto the first principal component (PC1) with a proportion of variance of 16% and the second principal component (PC2) with a proportion of variance of 10%. Monocyte subsets from 4-6 mice were analyzed per group. (C) Volcano plot analysis from the analysis SRL-/- vs. RL-/- for the visual identification of genes with statistically significance and a large magnitude fold change. Vertical dashed lines indicate log2-transformed +/-2.0-fold changes and horizontal solid line denotes -log10-transformed p-values <0.05. Thick black dots represent differentially expressed mRNAs of SRL-/- and RL-/- monocytes. Data from 9-10 mice per group are shown. (D) Venn diagram illustrating the effects of the RAG2 deletion on the one hand and the SOCS-1 deletion on the other hand on the differential gene expression in SRL-/-, RL-/- and L-/- monocytes.